Business Intelligence
CYNOR Solution – Transforming your Data into Valuable, Visually Appealing Information.

Tell your data story your way
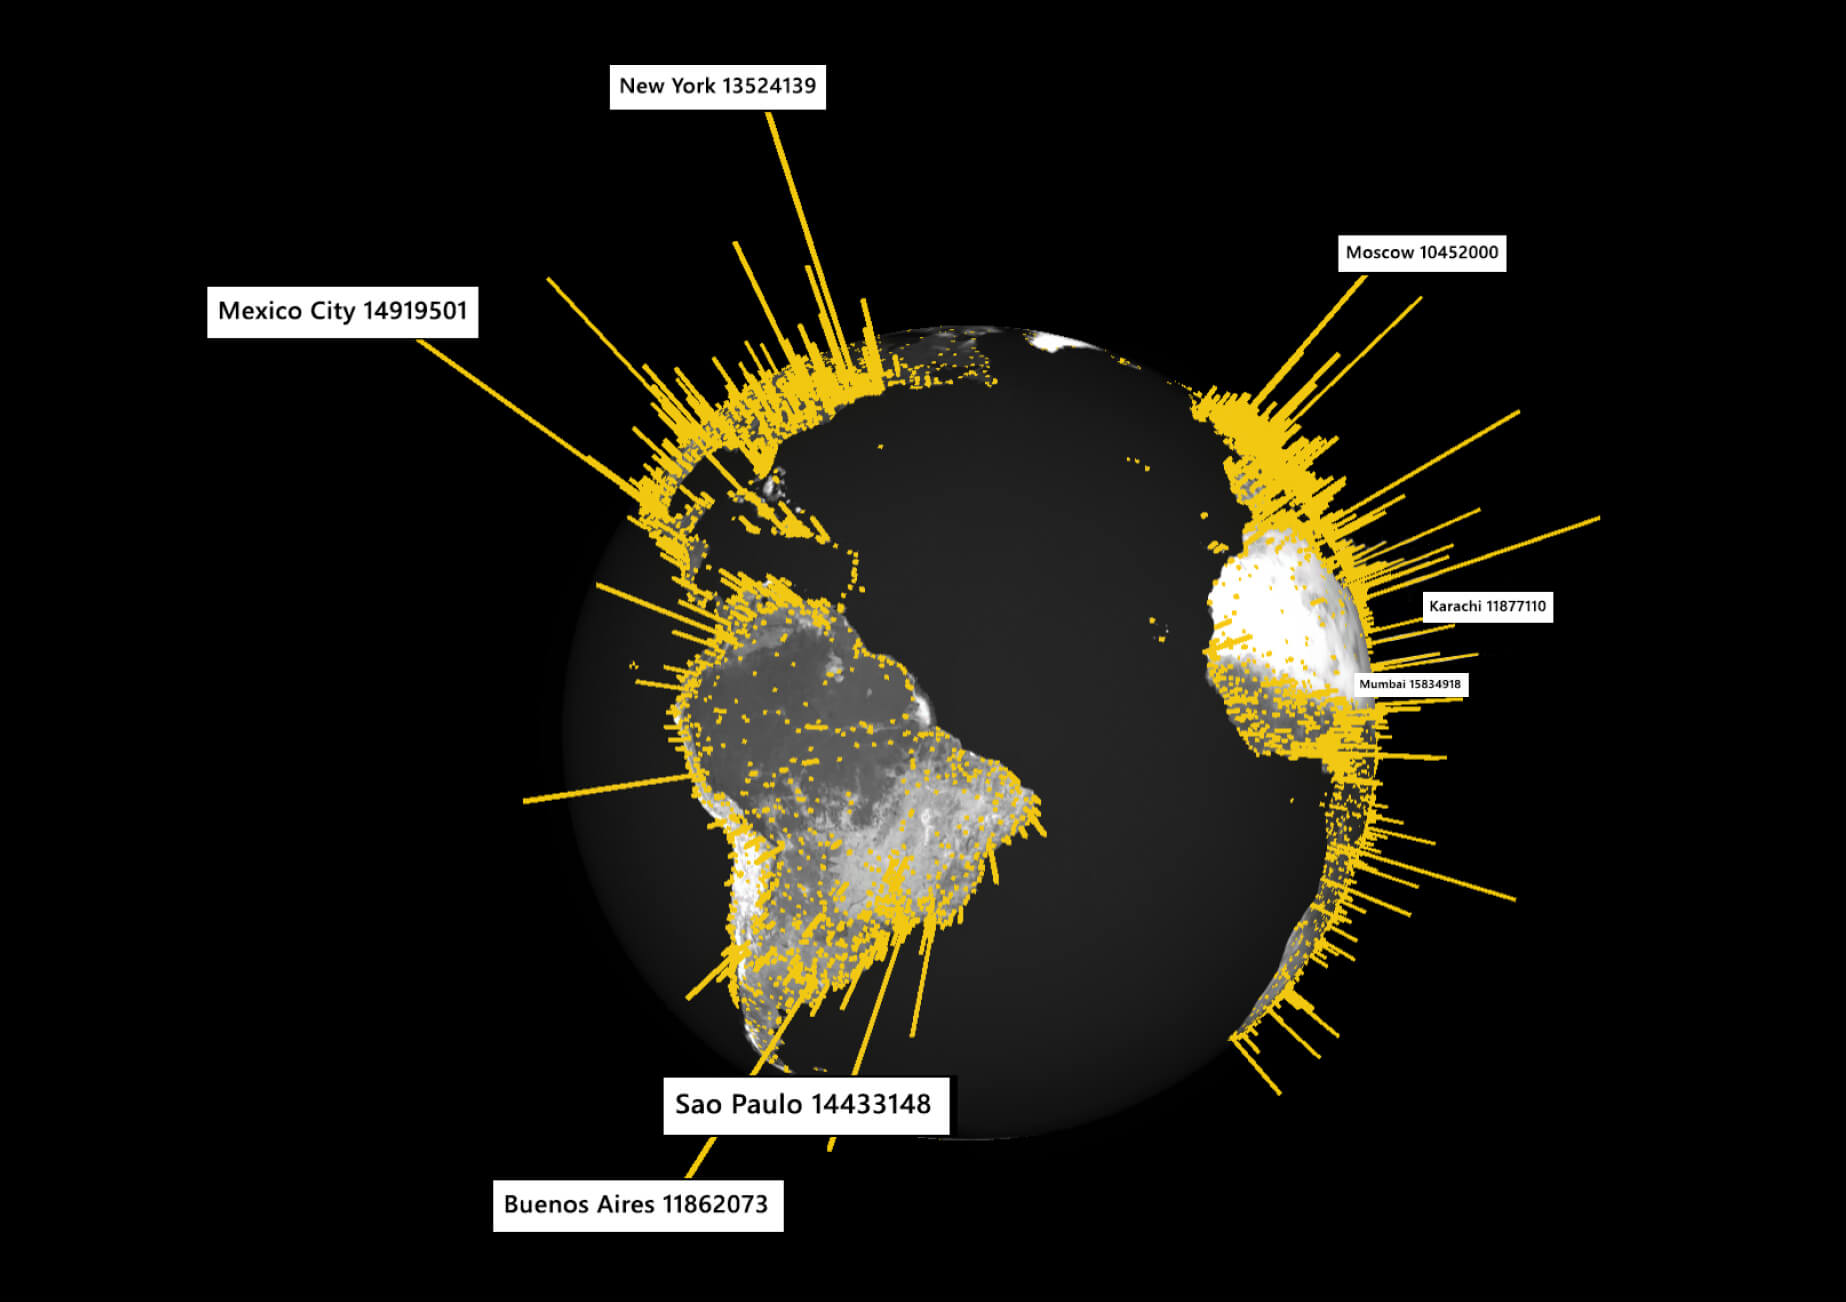
Bring your data to life with stunning, interactive data visualizations tailored to your organization and industry.
Make complex topics compelling and accessible
Anchor data storytelling to facts through visuals, which enable your audience to connect with the information. Share insights more effectively and increase comprehension, retention, and appeal with eye-catching visuals that help you interact with your data and make informed decisions quickly.
See data visuals in action
Explore how data visualization transforms complicated information into something that’s easy to share and understand with this interactive airplane engine diagnostics visualization.
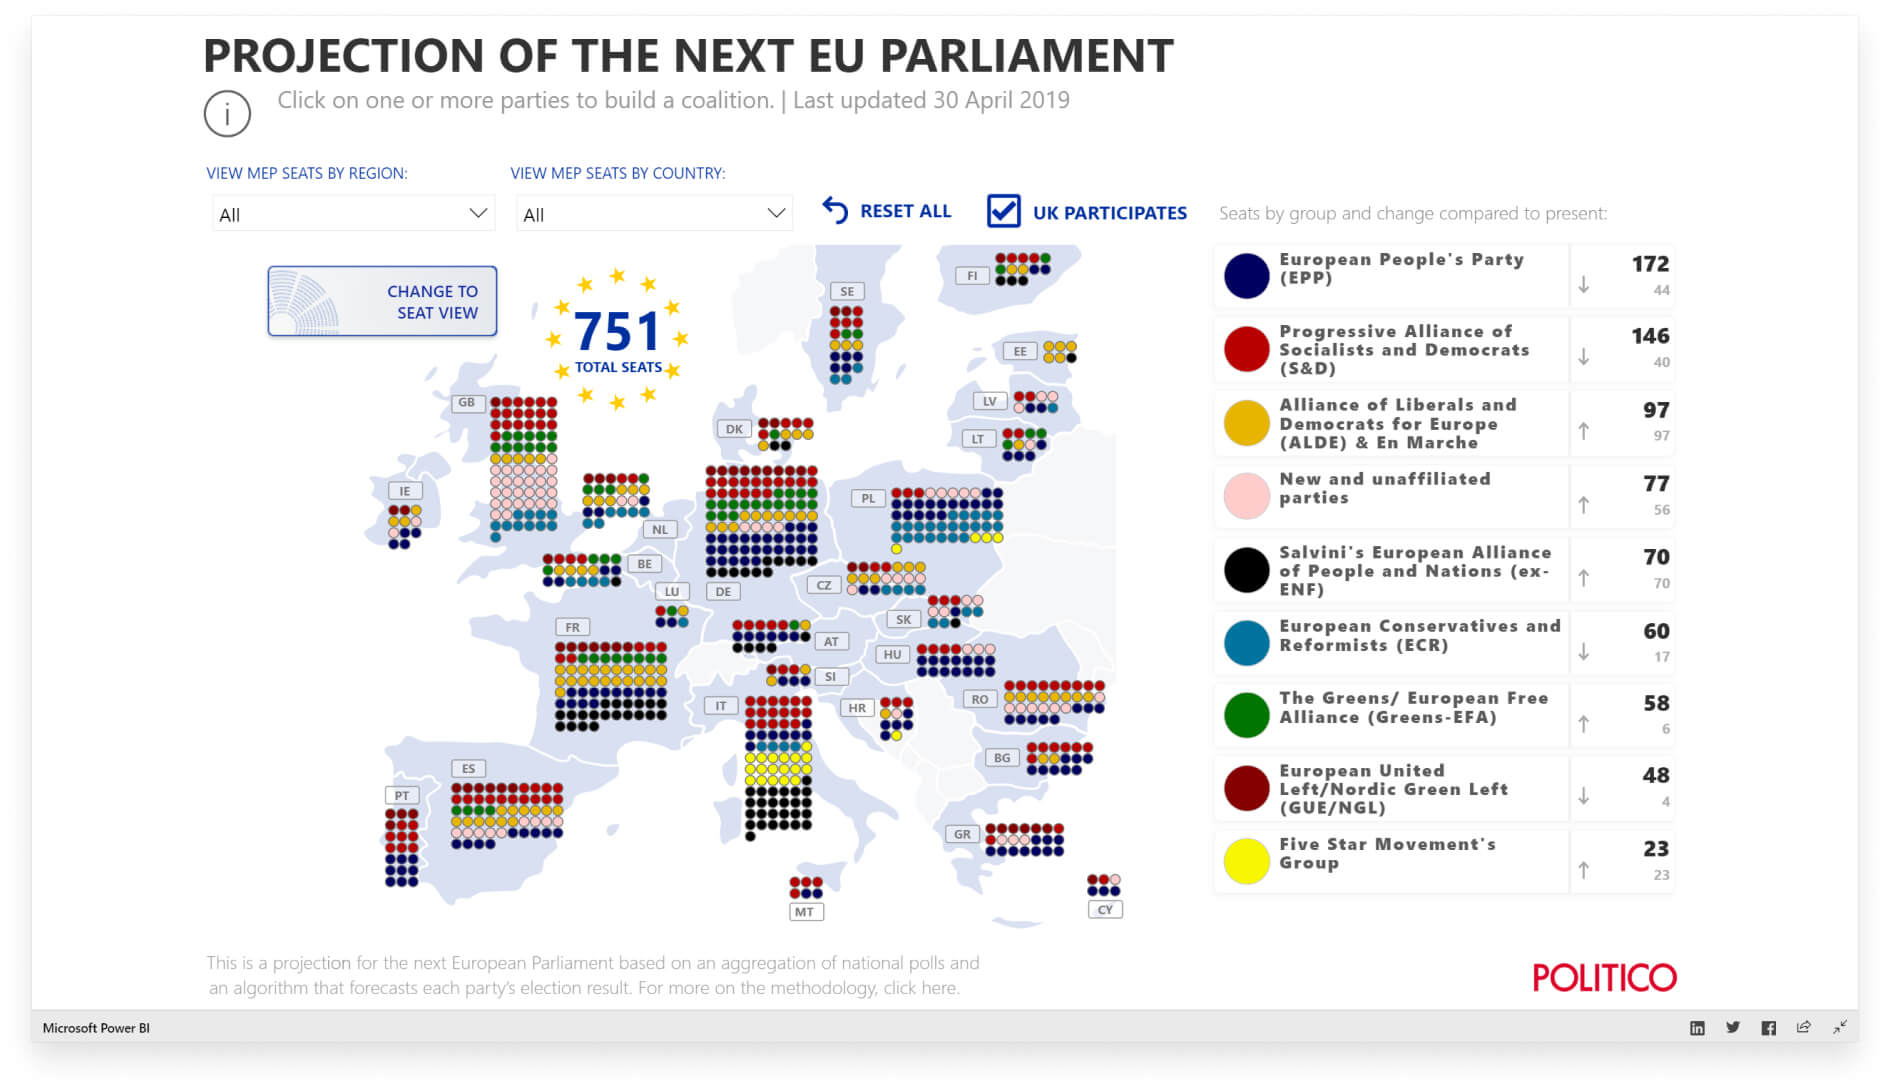
Get started quickly with hundreds of visuals
Start visualizing your data in seconds with an extensive library of data visualizations. Browse hundreds more in AppSource. Each visual has been tested and approved by Microsoft to integrate seamlessly with Power BI and provide valuable insights.
Build visuals to your specifications
If you can’t find the visual you need in AppSource, easily create it yourself. Tailor custom data visualizations to your requirements and industry to differentiate your organization and build something unique. When they’re ready, you can easily share what you’ve built with your team or publish to the Power BI community.